
The Dashboard is a Cypress service that gives you access to recorded tests. The Dashboard provides you insight into what happened during your tests run.
From the Dashboard you can:
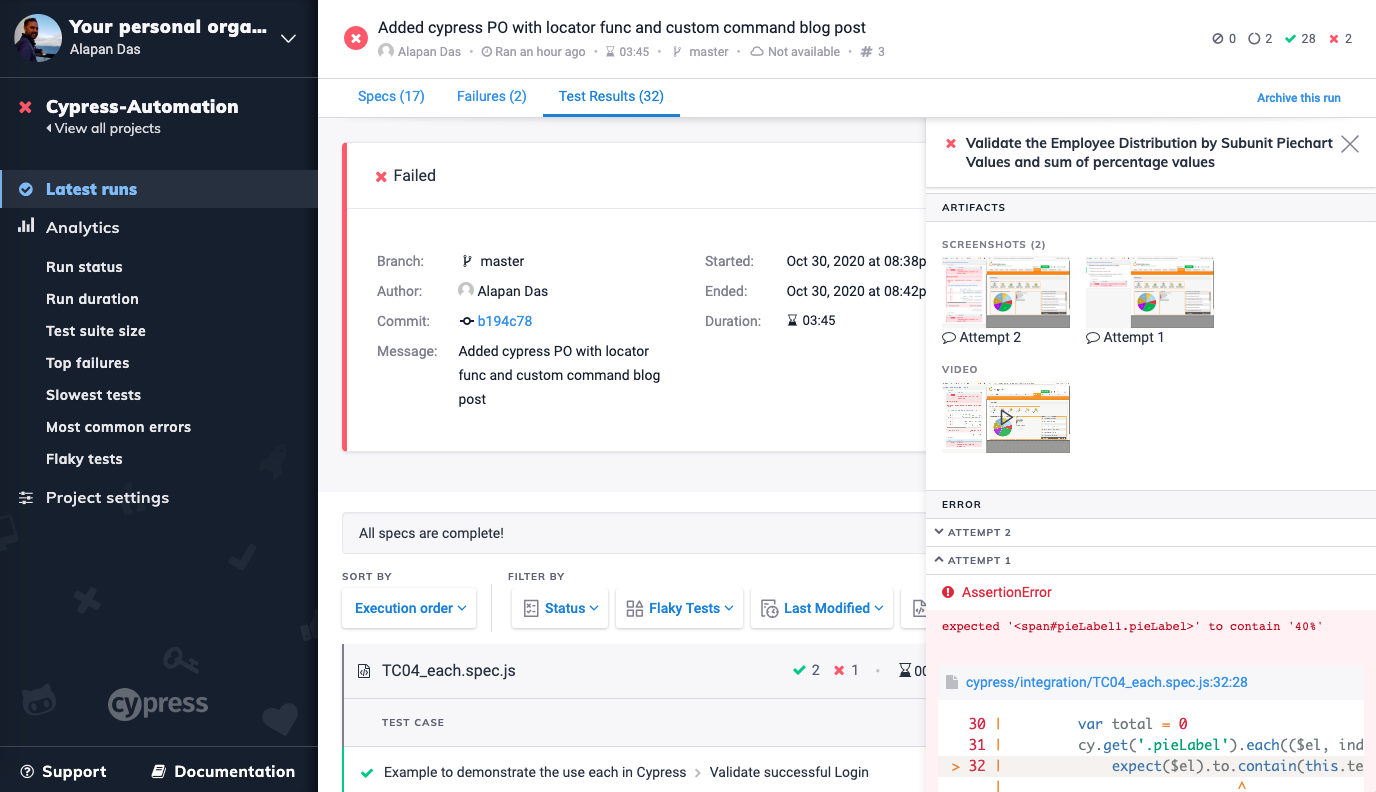
– See the number of failed, passing, pending, and skipped tests.
– Get the entire stack trace of failed tests.
– View screenshots of failed tests.
– Watch a video of your entire test run or a video clip at the point of test failure.
– See how fast your spec files ran within CI including whether they were run in parallel.
– See related groupings of tests.
To set up the Dashboard you need to do the following:
Step 1: Open the Test runner and Go to ‘Runs’.
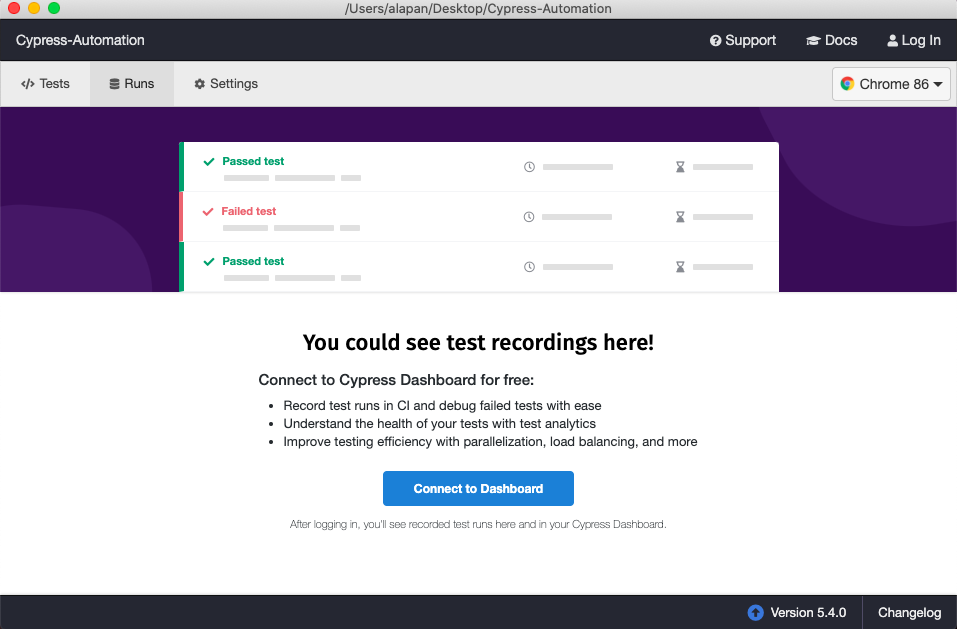
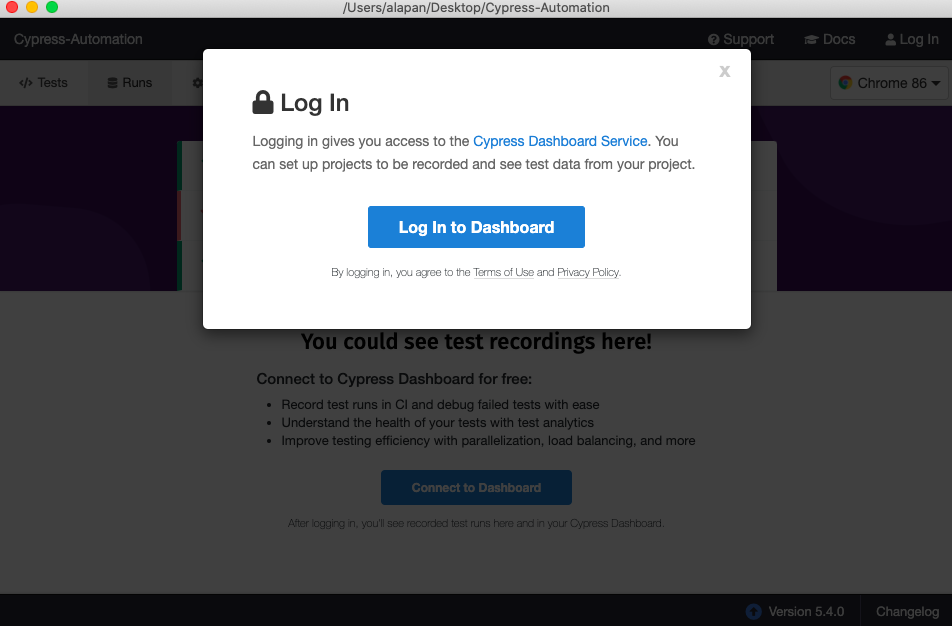
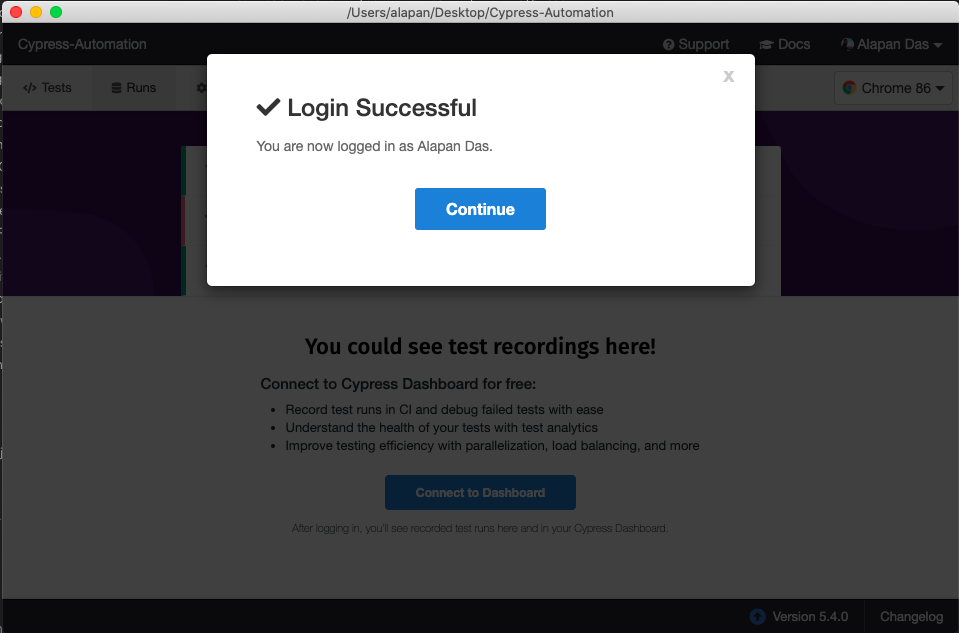
Step 2: Click on ‘Connect to Dashboard’ and login using either Github, Google or SSO Account.
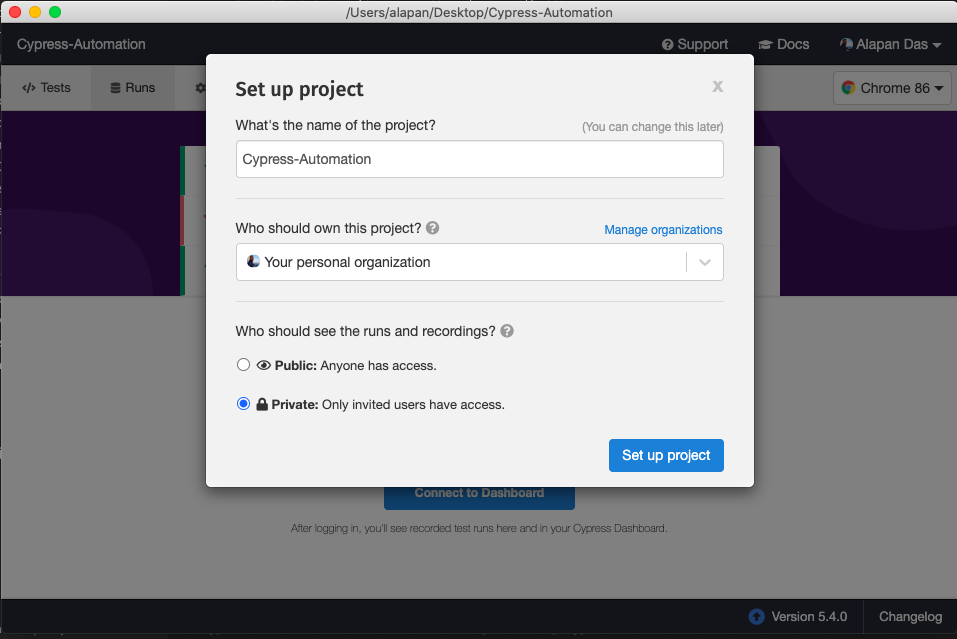
Step 3: Next Step is to set up the project. It comes with pre-filled details, but if you want to change them, you can. Make sure you change the option for Who should see the runs and recordings? to private if you don’t want your test runs to be publically available. And then finally click on the ‘Set up project’ button.
Step 4: Once you set up your project to record, cypress generates a unique projectId for your project and automatically inserts it into your cypress.json file. This helps cypress uniquely identify your project. The record key is used to authenticate that your project is allowed to record tests to the Dashboard Service. As long as your record key stays private, nobody will be able to record test runs for your project – even if they have your projectId.
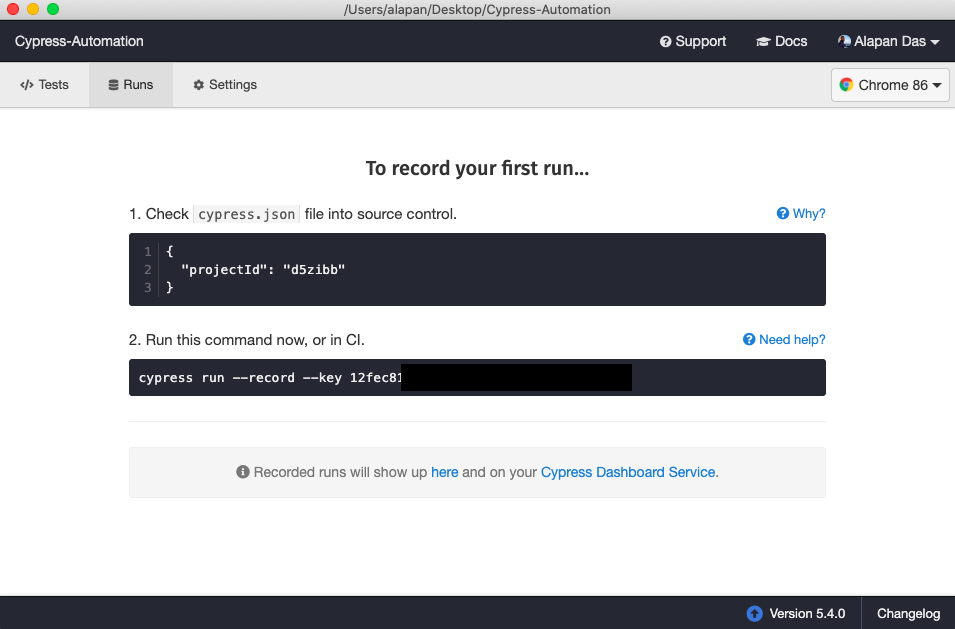
Step 5: Next step is to run the tests using the record key:
1 | npx cypress run --record --key 1nsadk-j938nk-84814-jasdjk |
Step 6: Now go to the Cypress Dashboard and check your test run. Cypress dashboard provide a lot of options like –
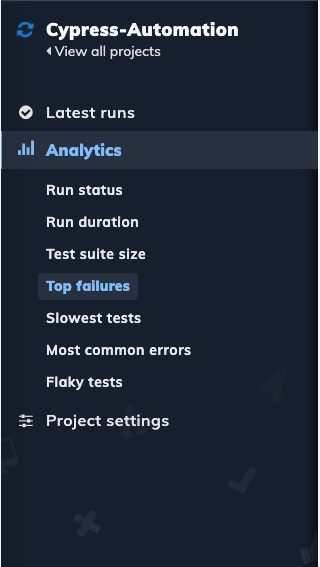
> It gives the history of all your test runs.
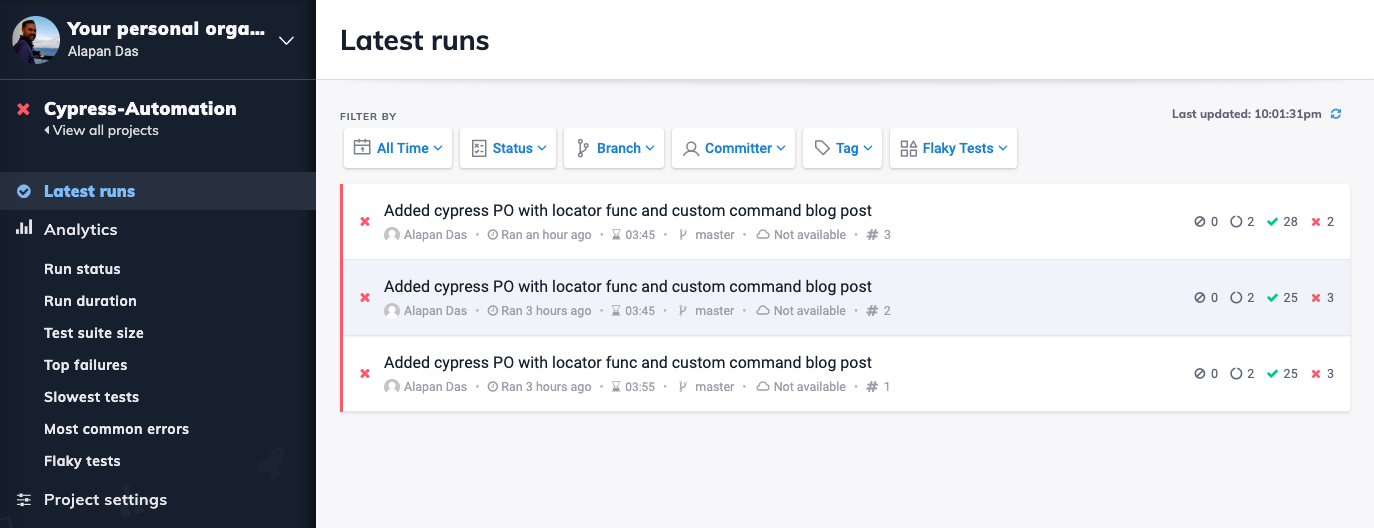
> It gives you a detailed timeline for every test case execution.
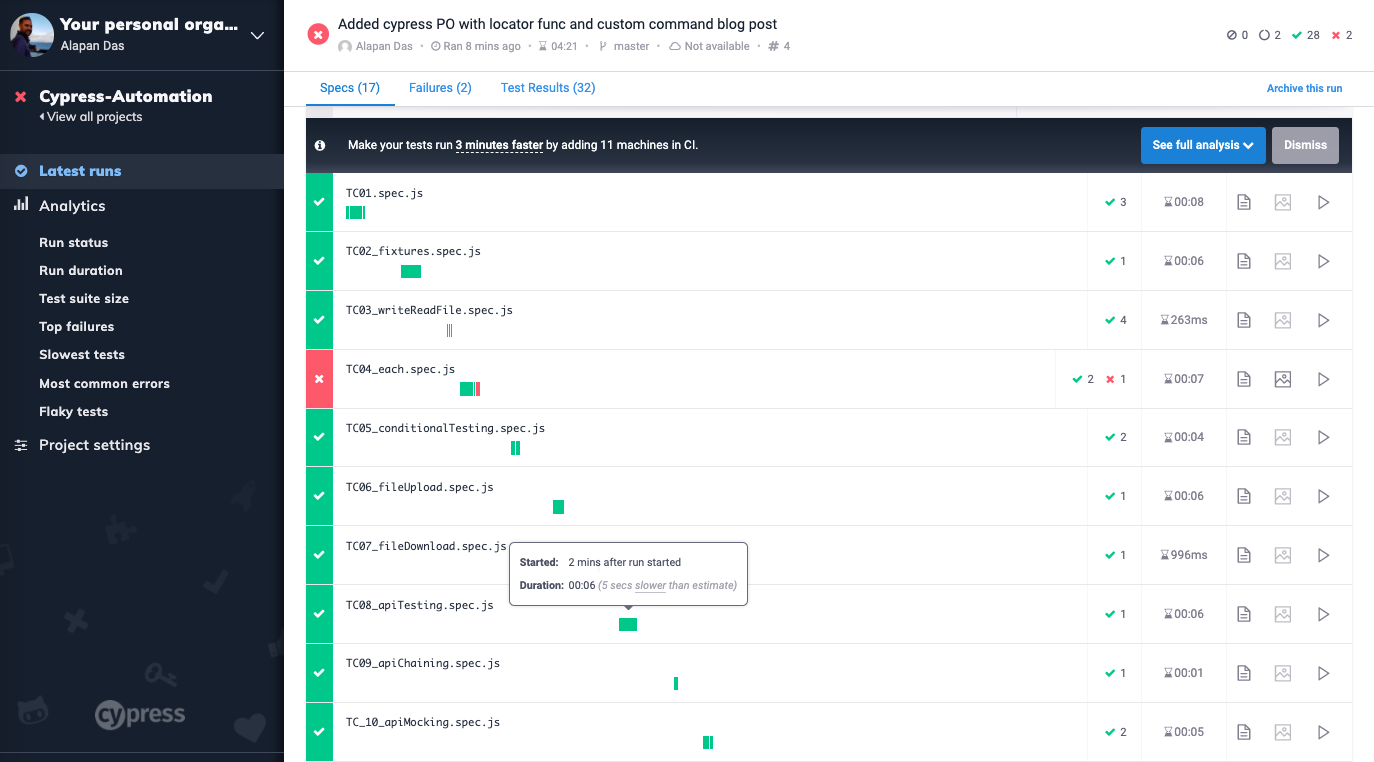
> For Failed test cases it gives you logs, videos, screenshots etc.
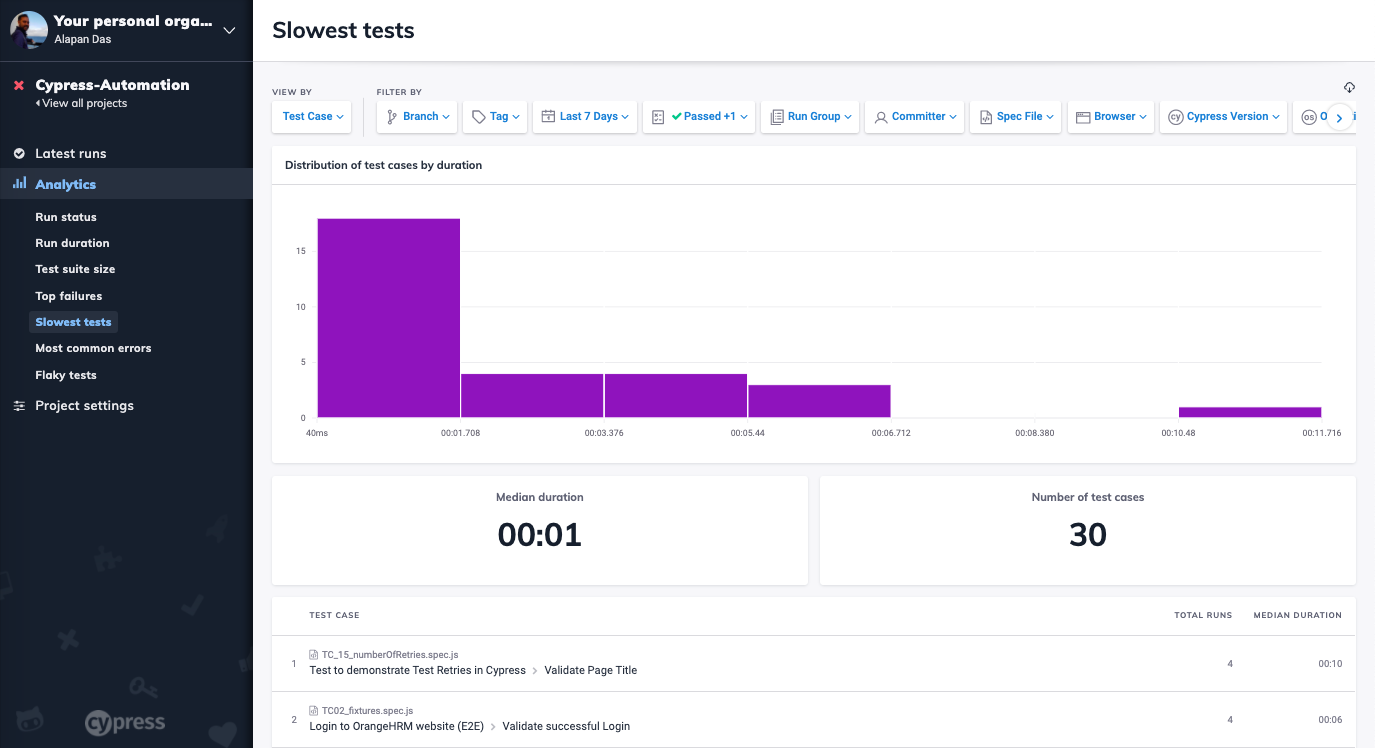
> It gives you detailed analysis of slow tests.
And many more… Dashboard Service has a free tier that allows 500 Test recordings per month, which is more than enough in my opinion if you are looking to explore and learn.
I hope you enjoyed reading this article. And do let me know in the comments about your most favorite Cypress Dashboard feature.
Also, Do check out 🙂
Github: https://github.com/alapanme/Cypress-Automation
All Cypress Articles: https://testersdock.com/cypress-tutorial/


